For Risk & Internal Audit
Risk registers that see the cascade, not just the line item.
Your risk register should show you the future, not just the past. RWRD connects risk to strategy and financial performance - so you can quantify the cascade before it happens.
A risk register is a system of record for what could go wrong. RWRD makes it a system of context, connecting each risk to the objectives and metrics it threatens, with the why attached.
See RWRD in action.
2-minute walkthrough, from raw data to strategic briefing.
The problem you already know
Risk management is stuck between expensive GRC platforms and disconnected spreadsheets. Neither connects risk to the metrics that matter.
Disconnected from strategy
Your risk register exists in a spreadsheet or a GRC tool that nobody outside the risk team reads. Risks are assessed in isolation - you cannot see which financial & performance metrics or strategic objectives each risk affects. That is the norm, not the exception: only 26% of organizations report a holistic, cross-functional view of their risks (KPMG Risk & Resilience Survey, 2025).
Cascades are always a surprise
When a risk materializes, the cascade is discovered after the fact. Revenue impact, operational disruption, strategic setback - all reactive, never anticipated. The cost is measurable: firms without board-level enterprise-risk visibility were 20% more likely to suffer six or more critical events (Forrester, 2025).
GRC tools are overkill and overpriced
Enterprise GRC platforms cost $100K+ and take 6 months to implement. Most implementations fail due to lack of adoption. Companies need structured risk management without the complexity tax.
Heat maps that connect to nothing
Your current tools show a heat map that does not connect to anything operational. Leadership sees colored squares but cannot answer: "What happens to revenue if this risk goes red?"
Structured risk management without the $100K price tag
Enterprise GRC platforms were built for compliance teams at Fortune 500 companies. RWRD was built for risk leaders who need strategic context, not just control libraries.
| Capability | Spreadsheets | Enterprise GRC | RWRD |
|---|---|---|---|
| Risk register with categories & KRIs | Manual | Yes | Yes |
| Risk-to-strategy connection | No | Limited | Native |
| Cascade visualization | No | No | Network Map |
| Scenario simulation | No | Basic | AI-Powered |
| AI-driven risk intelligence | No | Add-on | Built-in |
| Time to value | Hours | 3-18 months | Minutes |
| Annual cost | $0 | $100K+ | Free, $499/mo |
What RWRD looks like for risk professionals
The structure your governance requires. The connections your leadership team needs. The intelligence that makes risk conversations actionable.
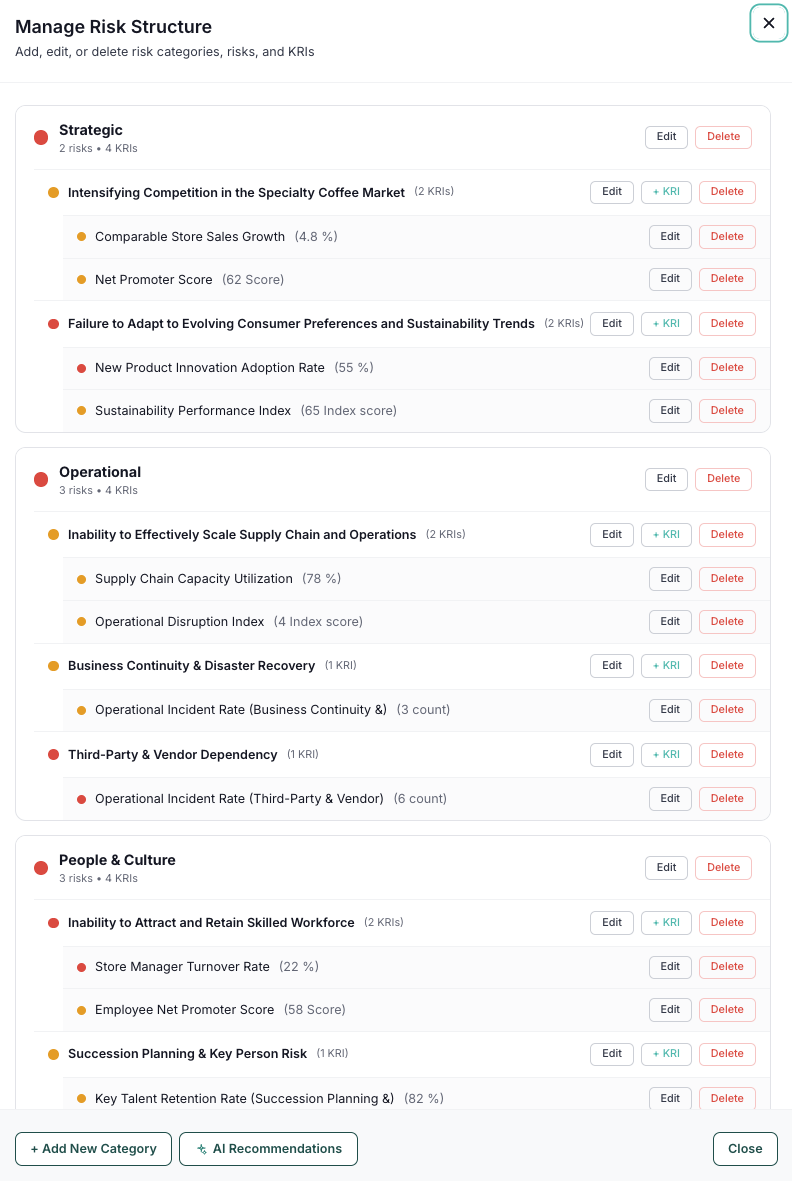
Structured risk register
Categories, individual risks, and Key Risk Indicators (KRI) in a hierarchy built for governance. Risk assessment and KRI tracking to monitor exposure against your risk appetite and tolerance levels. AI recommendations to help you improve and move faster.
The structure your audit committee expects, without the 6-month implementation.
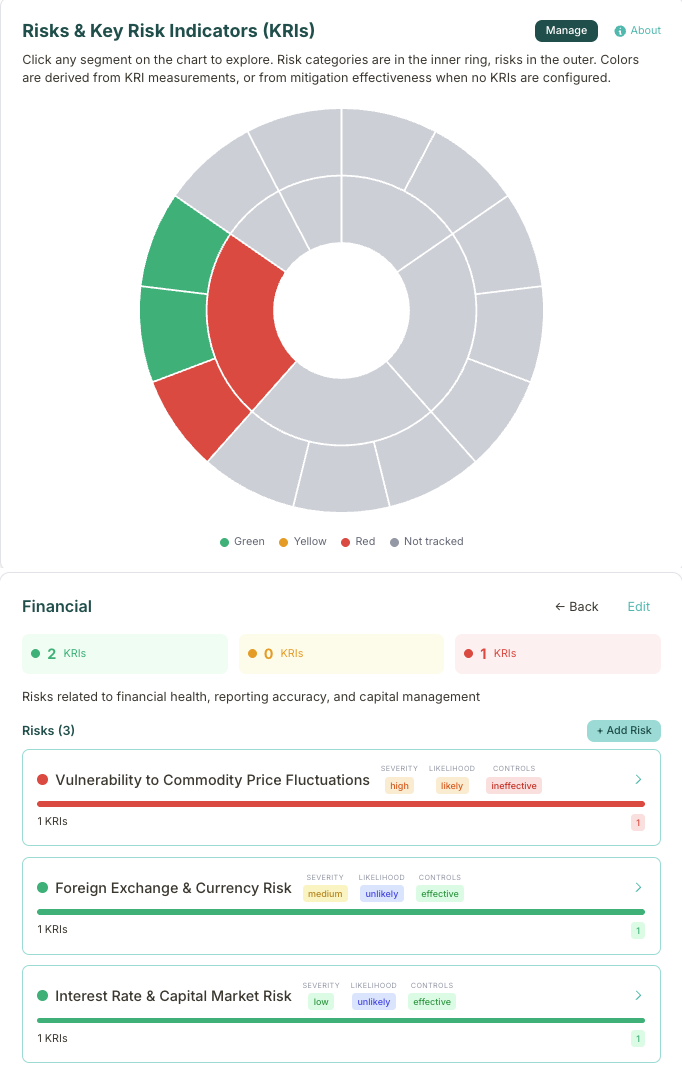
Visual risk navigation
Explore your risk landscape through an interactive sunburst that organizes categories, risks, and KRIs in concentric layers. RAG status rolls up from indicators to risks to categories, drill into any segment to see what's driving the color.
One click from category overview to individual KRI detail.
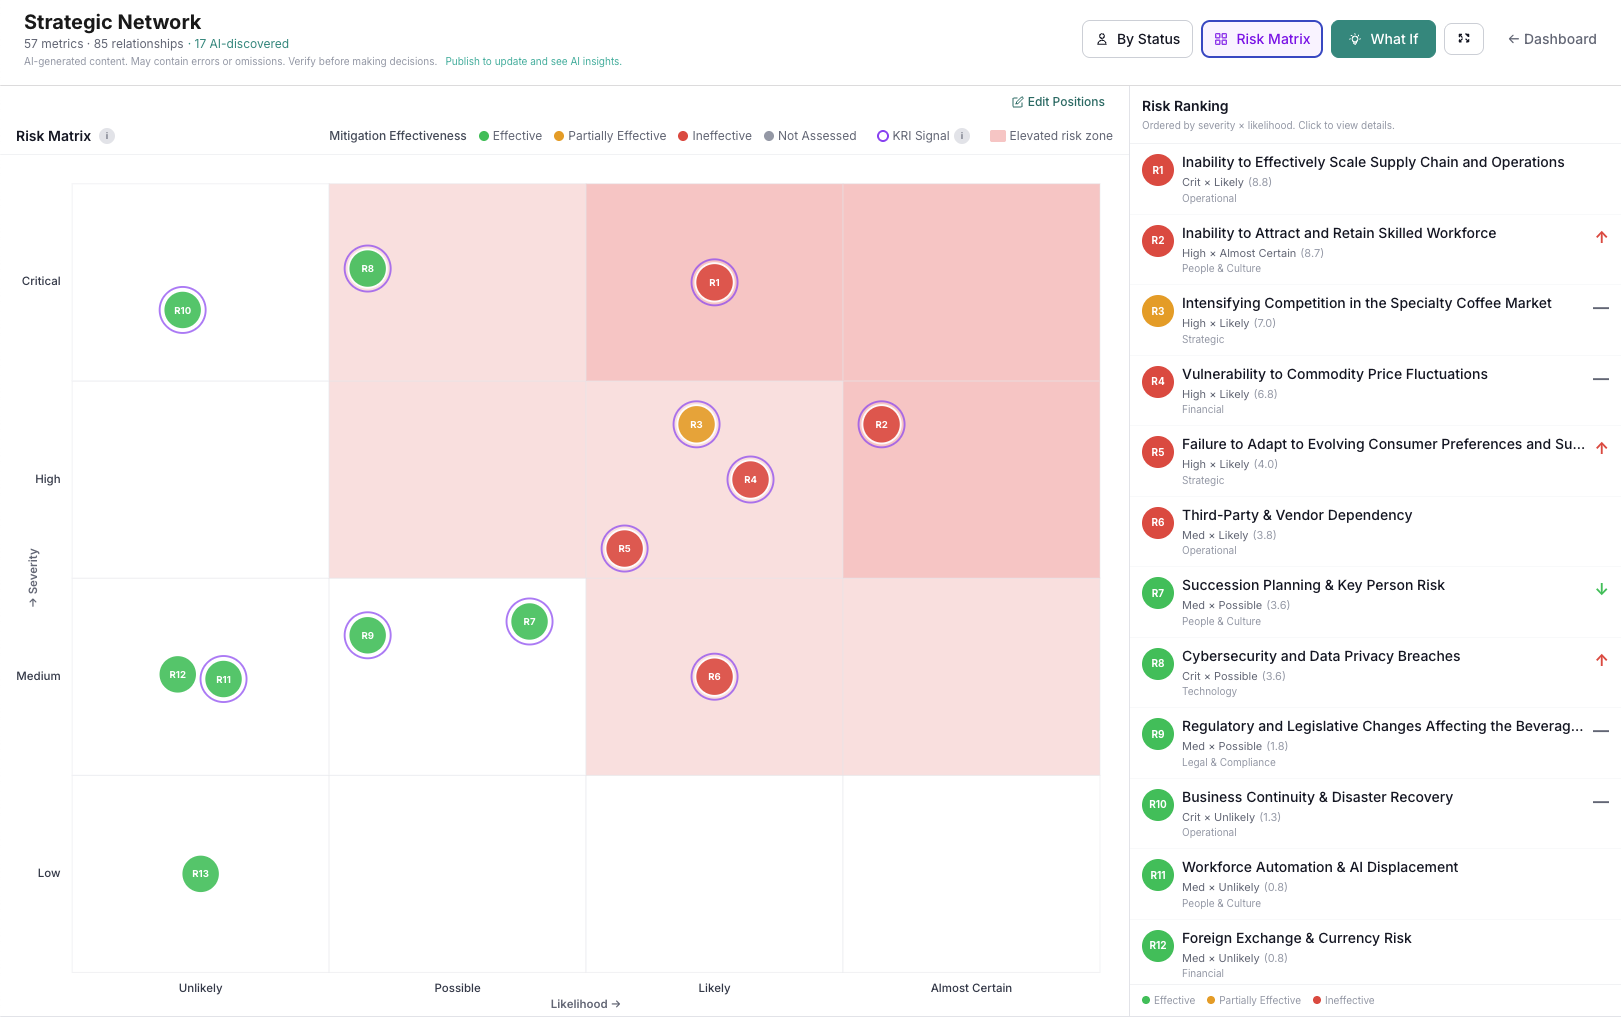
Risk Heatmap
Visual severity-by-likelihood matrix. Drag to reposition risks as assessments change. Immediate visual communication of risk posture across the organization.
Export-ready for board and audit committee presentations.
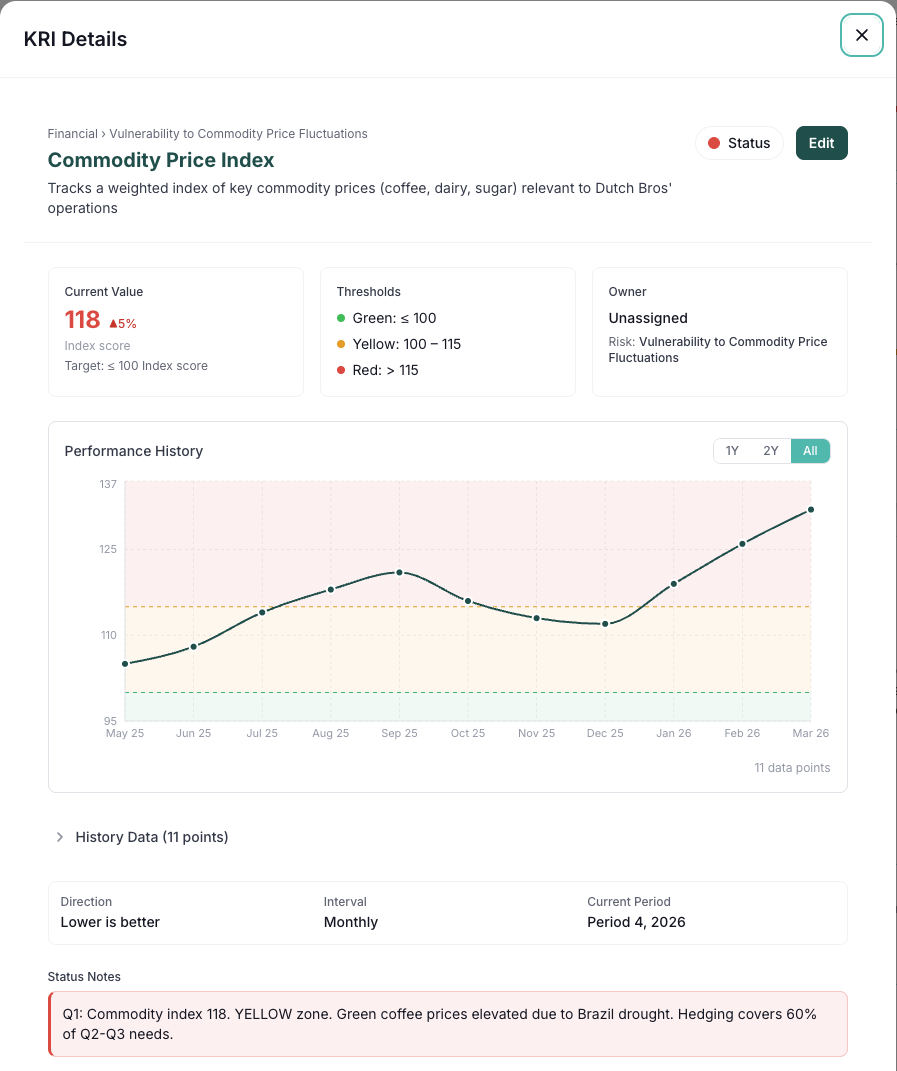
KRI thresholds with automated RAG status
Define green, yellow, and red thresholds for every Key Risk Indicator. Status computes automatically from your latest reported values - no manual status updates, no stale formulas.
Contributors update KRI values on schedule. Automated reminders handle follow-up.
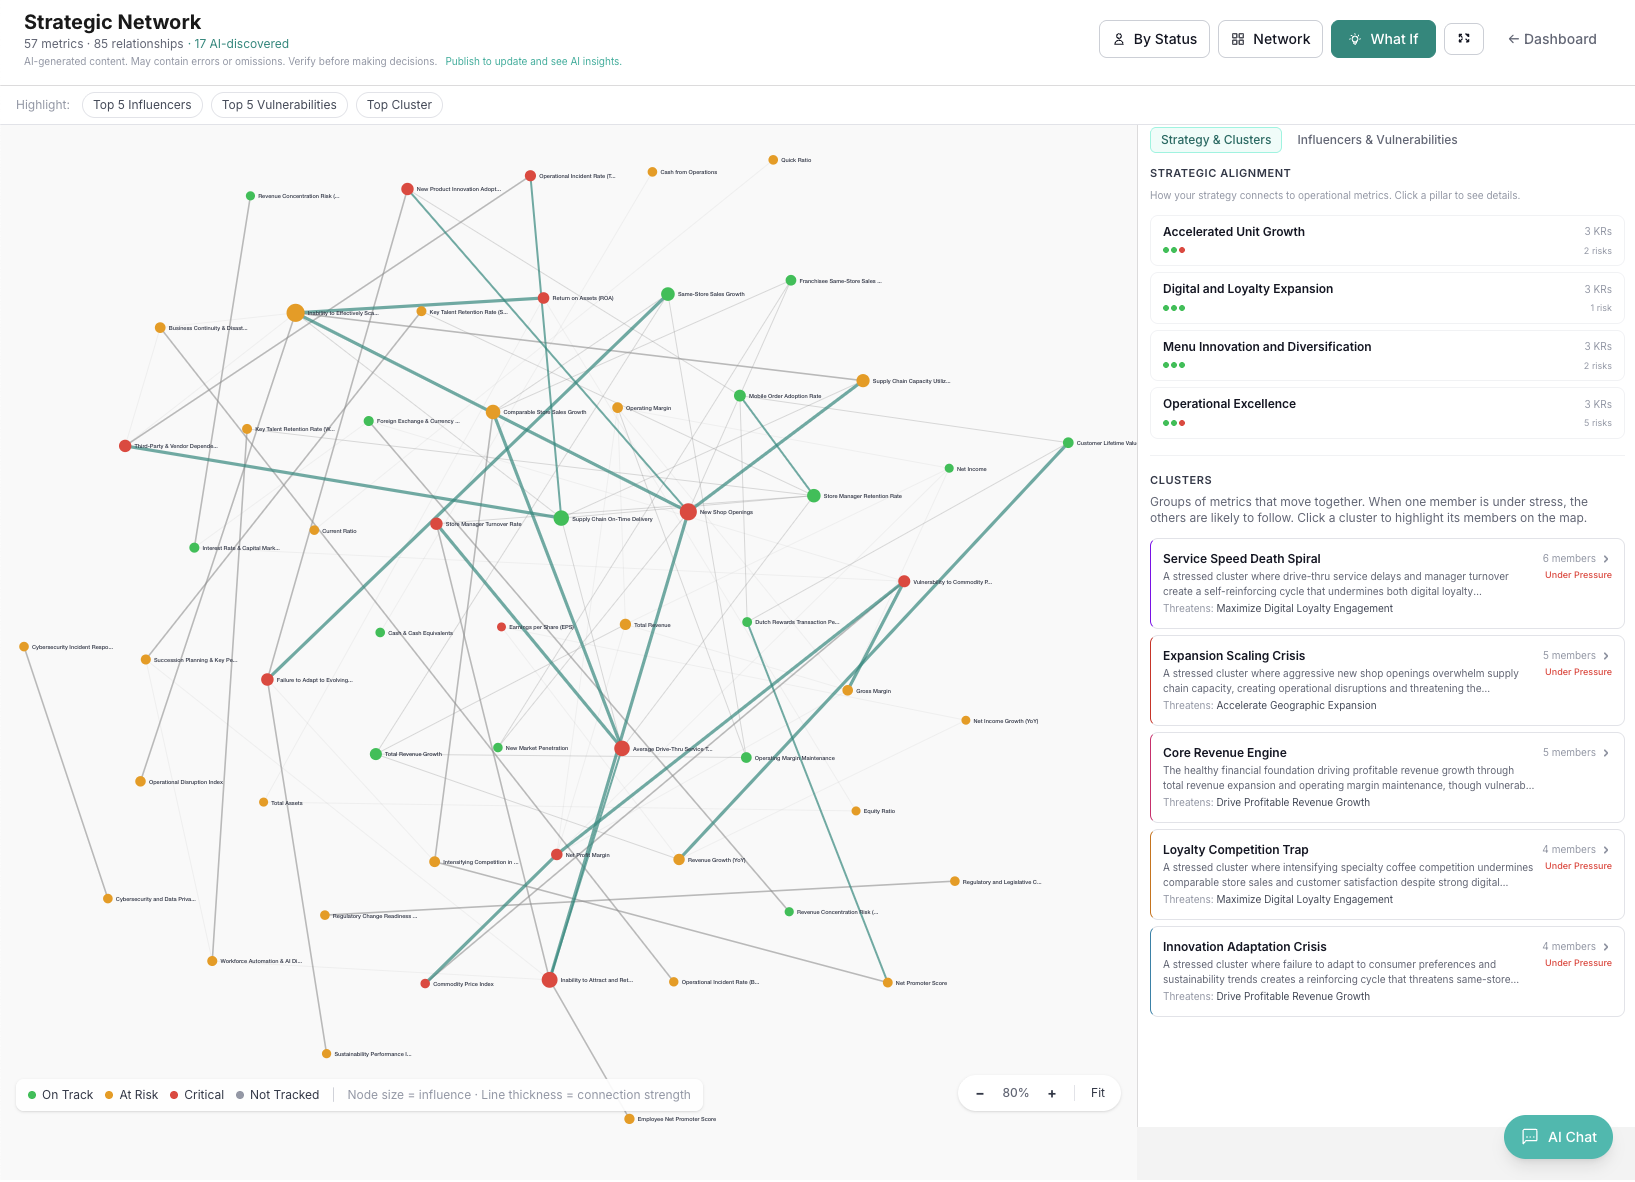
Network Map
See which financial & performance metrics and OKRs are connected to each risk. When a risk goes red, immediately see the cascade to financial performance and downstream strategic objectives.
AI discovers hidden connections. Community detection reveals thematic risk clusters. Cascade chain analysis shows propagation paths.
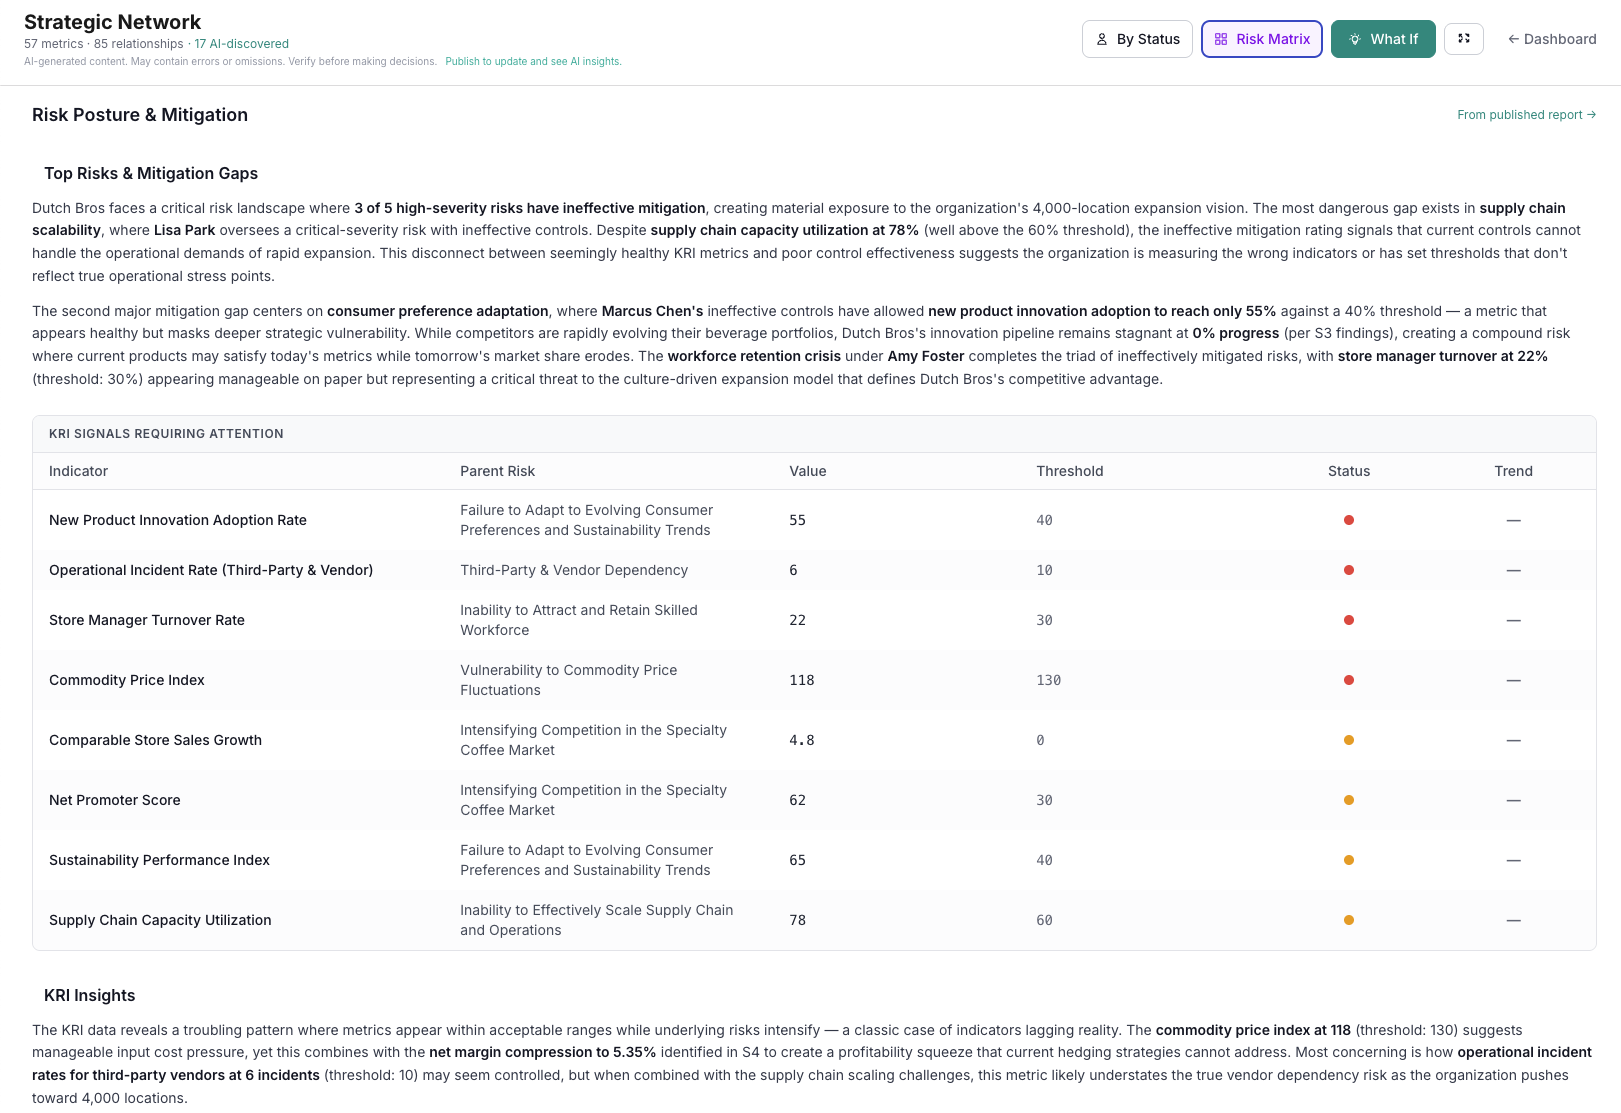
AI Risk Intelligence
AI-generated risk posture analysis grounded in your actual data. Top mitigation gaps, KRI signals requiring attention, and emerging compound threats - surfaced automatically from your published dashboard.
Multi-pass AI discovery analyzes cross-domain relationships, RAG correlations, and risk-performance interactions.
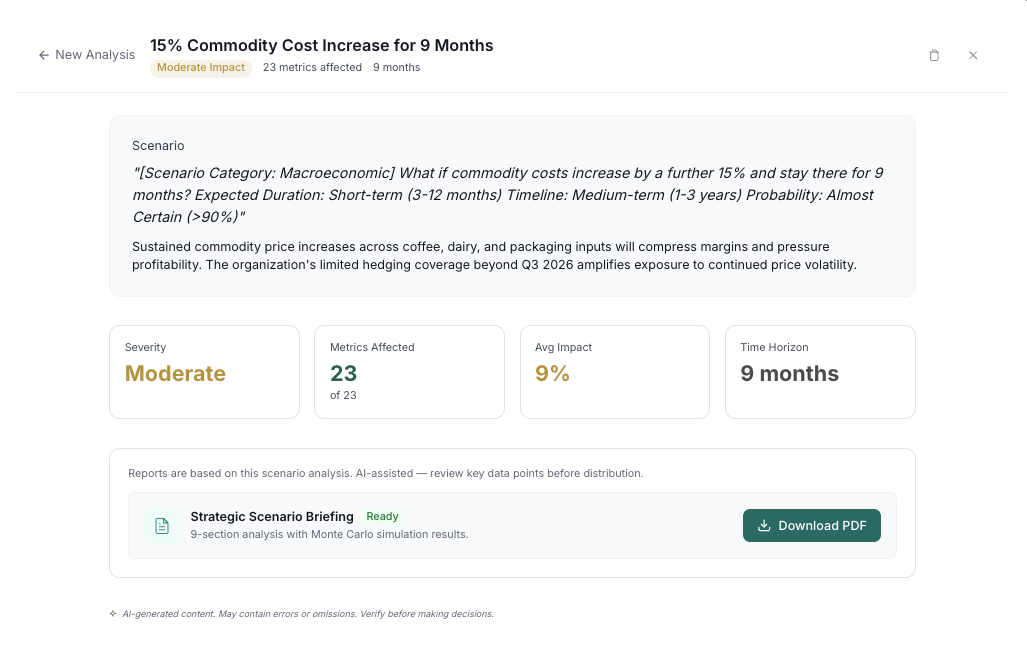
Scenario Analysis
Model risk scenarios before they materialize. Upload supporting documents, run AI analysis with web research, and download a branded PDF briefing for your board.
Quantified impact analysis that turns risk conversations from qualitative debate into data-driven decisions.
When a threshold is breached, capture the why, so the same surprise doesn't happen twice.
Status notes and action plans already travel with every risk and KRI, so the reasoning behind a breach lives with the metric, not in someone's memory. We're extending that into the full learning loop the Complete Context Standard calls for: capturing why a target was missed and whether the fix worked.
The Intelligence Flywheel for risk leaders
Risk intelligence that compounds every cycle. Each layer builds on the last - your risk posture gets sharper with every quarterly review.
Define
Structure your risk register with categories, risks, KRIs, and thresholds
Measure
Track KRI performance against thresholds with automated RAG status
Discover
Reveal hidden risk-to-strategy connections via network science
Recommend
AI-generated risk insights and prioritized recommendations grounded in your data
Simulate
Model risk scenarios before they materialize with AI-powered scenario analysis
Simulation results feed back into L0, your risk intelligence compounds every cycle.
AICPA
SOC 2
GDPR
COMPLIANT
Built for teams that take security seriously
Risk professionals understand the cost of a security failure. RWRD is built with the same rigor you apply to your own risk assessments.
- SOC 2 Type 2 and GDPR compliance
- Encryption at rest and in transit (AES-256, TLS 1.2+)
- Role-based access control with MFA support
- Audit logging and GDPR Article 17 (right to erasure)
- Built by a former KPMG Risk Consulting Director
Common questions from risk leaders
"We need ServiceNow/AuditBoard-level GRC."
If your audit team needs 200+ controls with workflow automation, you need a full GRC platform. RWRD sits on top - connecting your risk posture to the strategic and financial context that makes risk decisions actionable. RWRD is designed to sit alongside your existing GRC tool.
"We need this for compliance."
RWRD is SOC 2 Type 2 and GDPR compliant with audit logging and MFA support. The structured risk register with assessment tracking satisfies common regulatory requirements for risk management documentation.
"How does RWRD handle the risk-to-strategy connection?"
Every risk in RWRD exists in the same dashboard as your OKRs and financial & performance metrics. The Network Map visualizes these connections explicitly. AI analysis references risk posture when answering questions about strategic objectives or financial performance. One Health Score that incorporates risk - not a separate heat map.
Build your risk register with AI assistance.
Structured risk management connected to strategy and financial performance. Free to start, no credit card required. Your first Health Score in minutes.